Vodostaj.rs
Real-time monitoring platform with a rule engine: founder-level execution · vodostaj.rs ↗ · Jan 2026 – Present
Context & Problem
No product in the Serbian or regional market aggregated hydrological data (river levels, flow, water and air temperature, pressure) from multiple national sources into one usable platform. The raw data exists: it sits on government portals in fragmented, non-actionable form. Primary audience: 250,000+ anglers in Serbia who use water conditions to decide where and when to fish, 89% of them on a phone, because people check rivers from the riverbank. Secondary: outdoor users, civil engineers, and emergency services who care about the same readings for very different reasons.
Why this project matters as a design case
Structurally this is the same problem as any industrial monitoring product: heterogeneous sources with different formats and reliability, continuous ingestion, a rule layer that decides what counts as an event, and an interface where a non-expert has to act on the result. The domain is rivers; the design problems are ingestion trust, threshold definition, alert traceability, degraded states, and forecast presentation.
My Role
Founder and sole designer-builder. Product strategy, UX design, and full AI-assisted development across the stack. Jan 2026 – Present. Live production product with real users, real data, and real consequences when the data is wrong.
User Dashboard
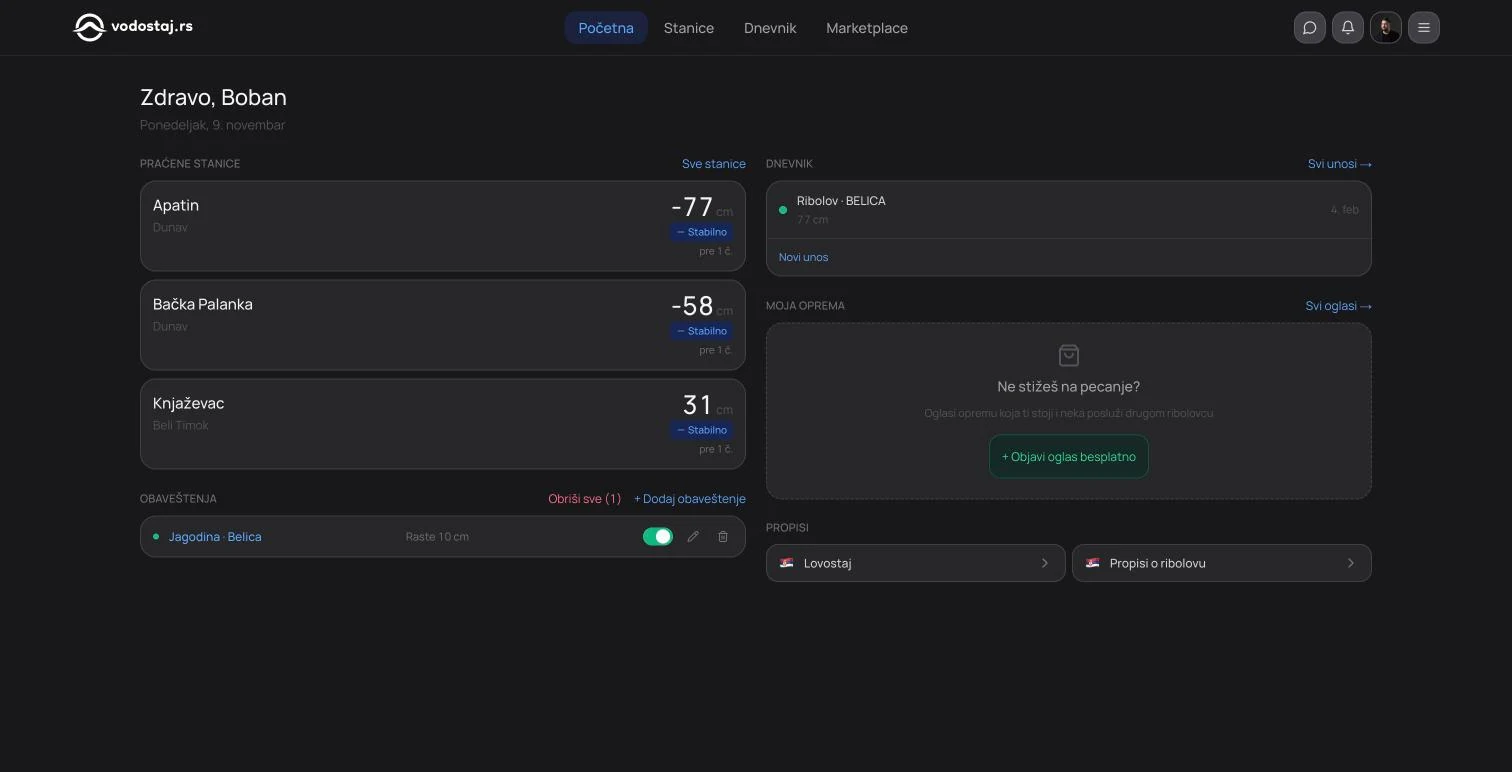
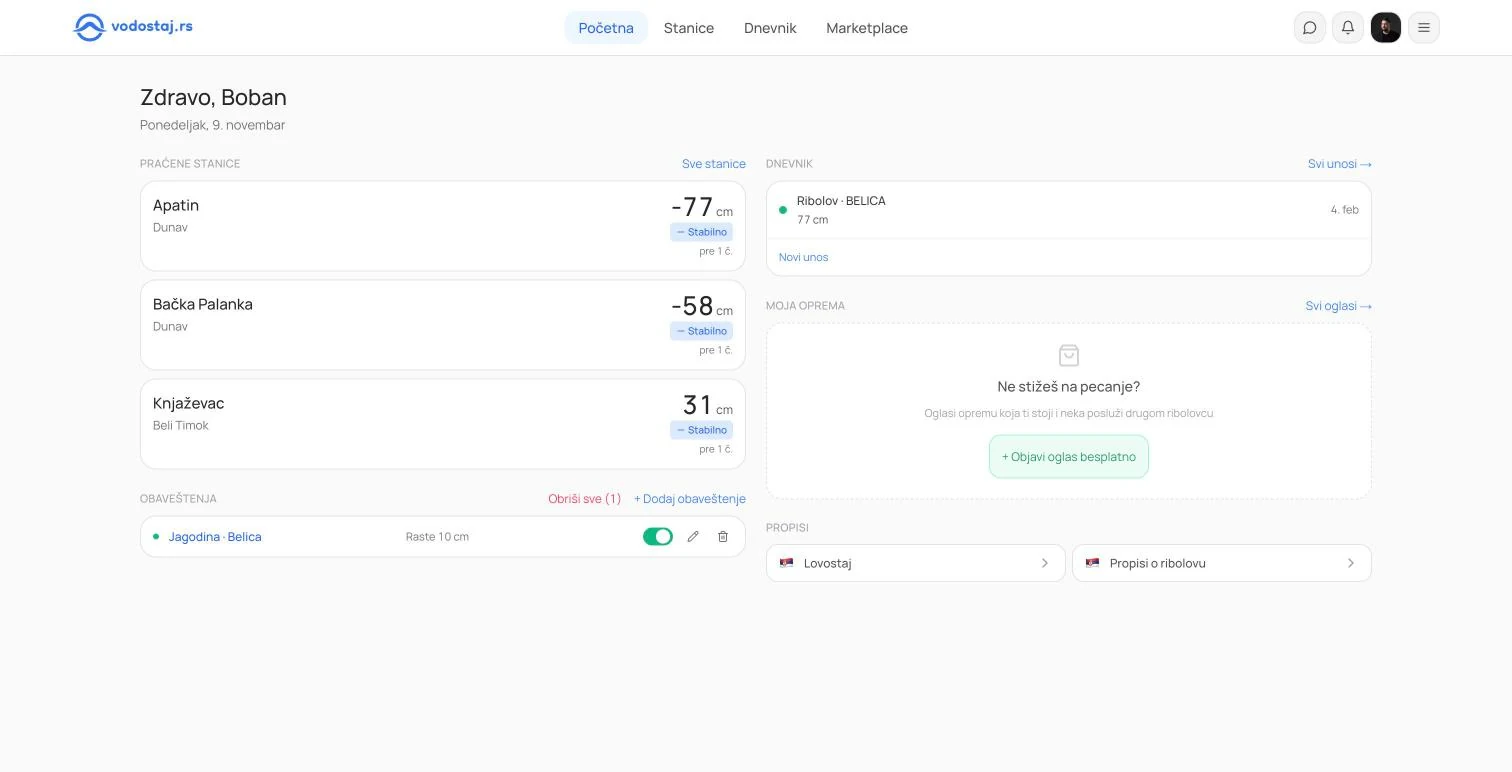
Authenticated user dashboard: tracked stations with live levels, active alerts, the fishing diary, the user's own gear listings, and quick links to closed seasons and fishing rules. Available in dark and light themes.
Station Detail Page
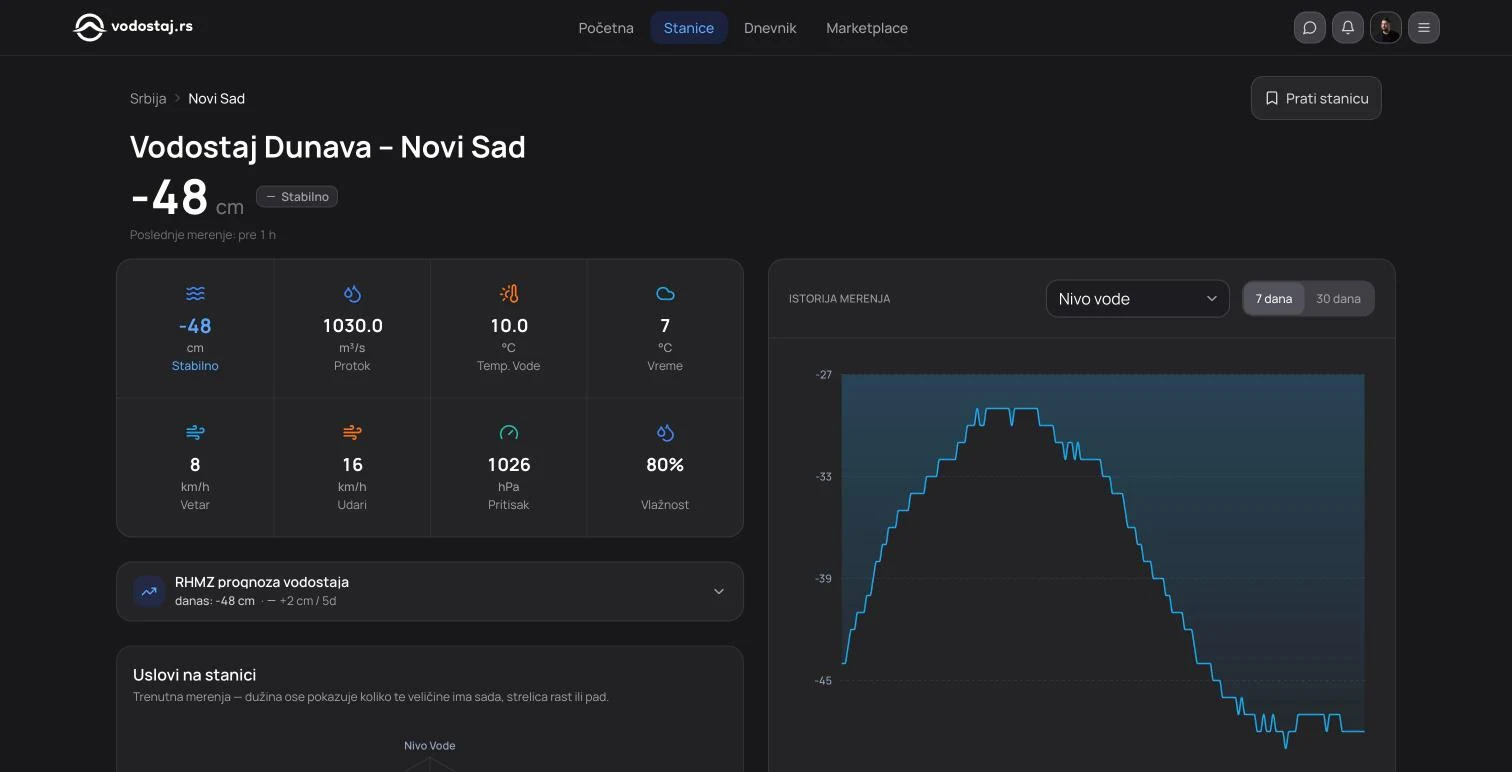
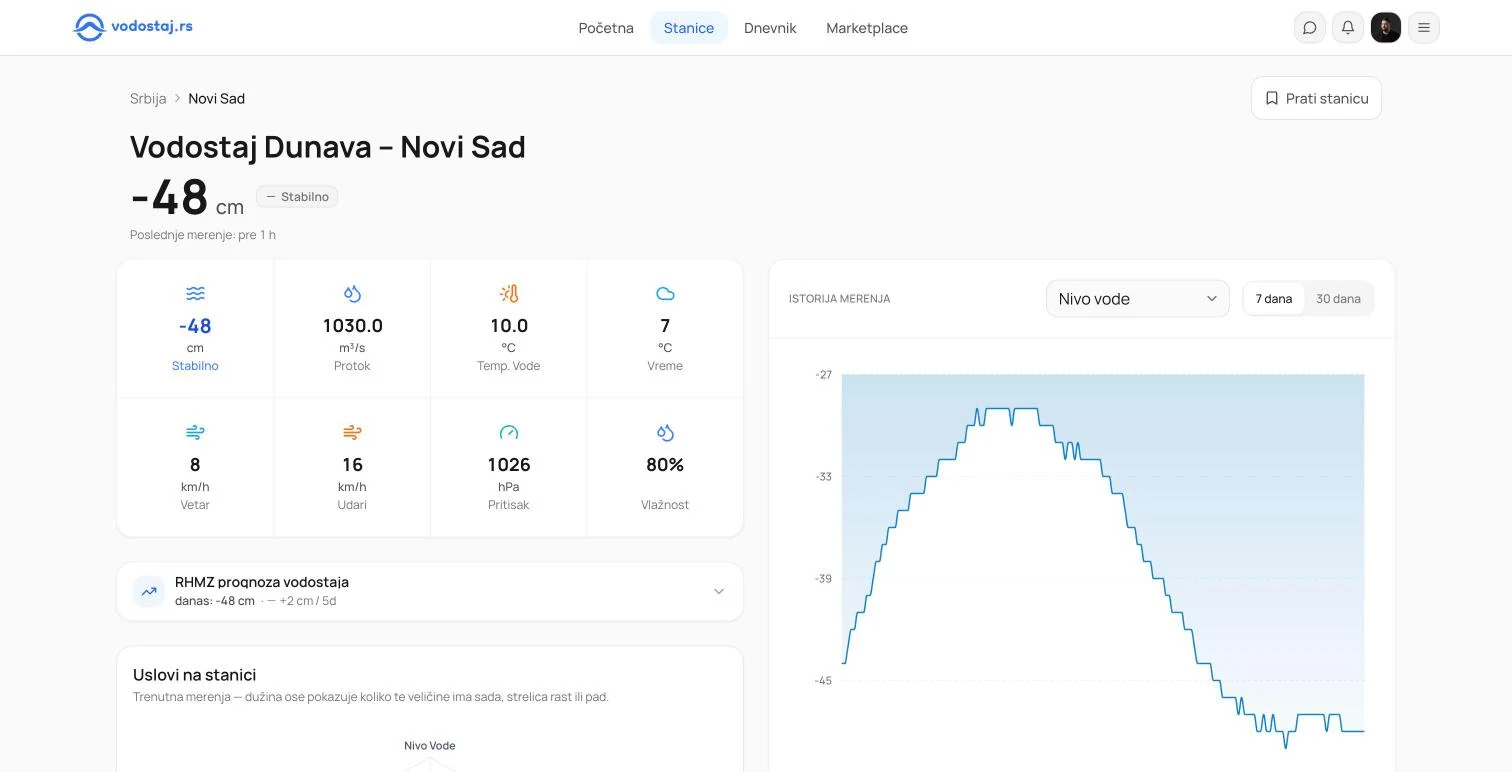
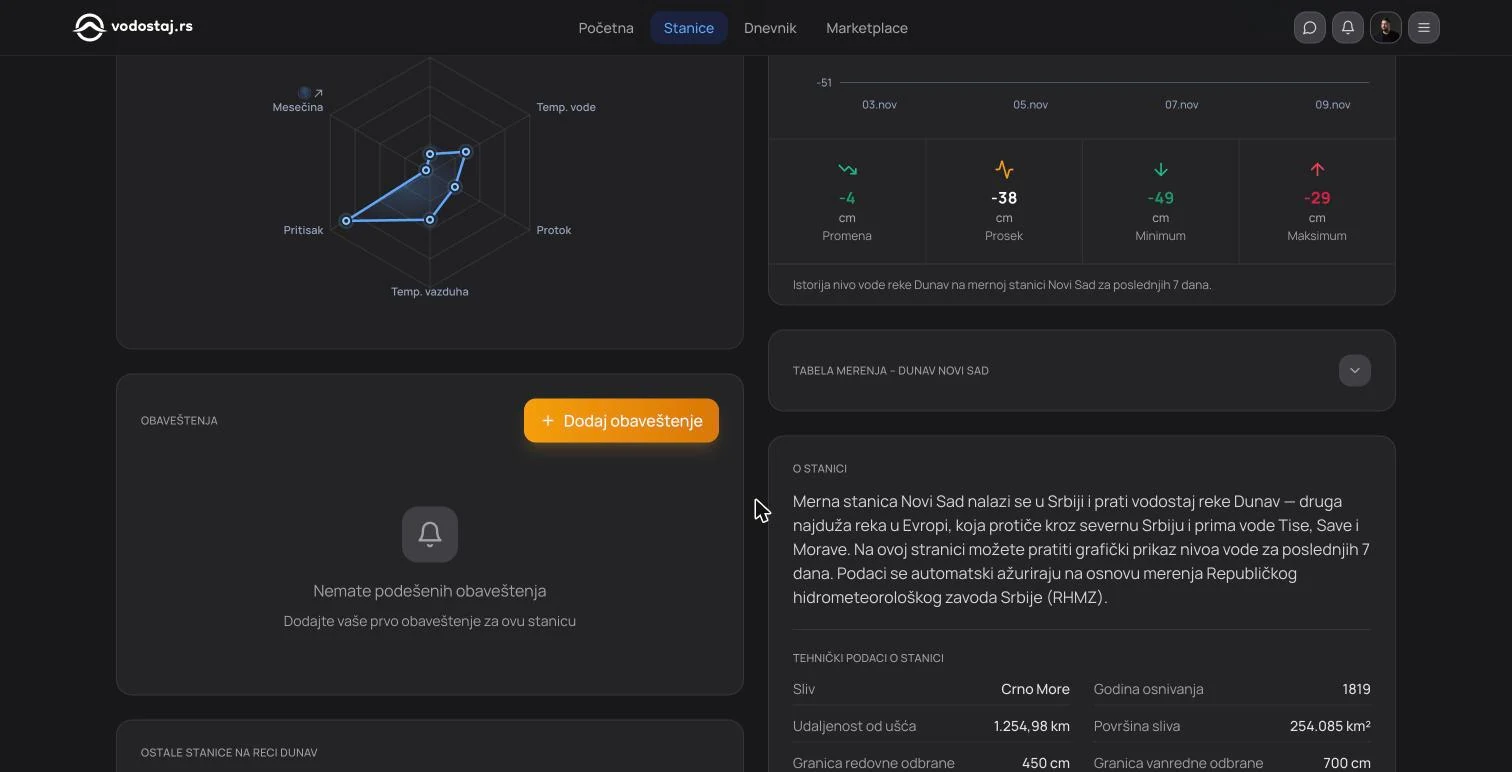
Full station detail: 8 weather metrics (level, flow, water temp, air temp, wind, gusts, pressure, humidity), the official RHMZ forecast, a conditions radar, a 7/30 day chart with min/avg/max, notification setup, a measurement table, and technical facts about the station such as basin, year of founding and flood defence thresholds. Other stations on the same river sit below.
The rule engine: from raw reading to traceable alert
The platform is not a dashboard, it is a rule engine with a dashboard on top. Every ingested measurement is evaluated against two independent rule sets, and the interface has to make both legible to someone who has never read a hydrological chart.
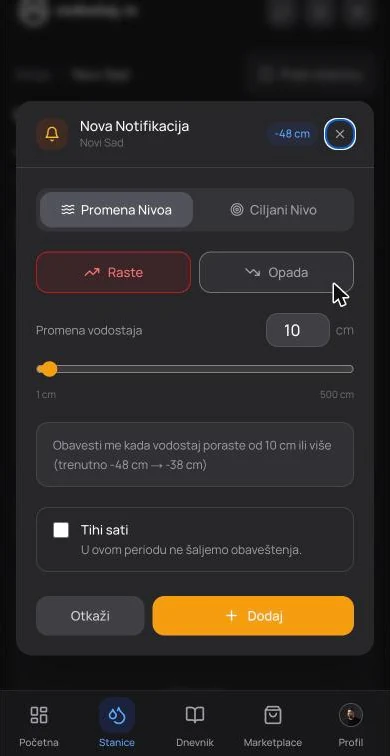
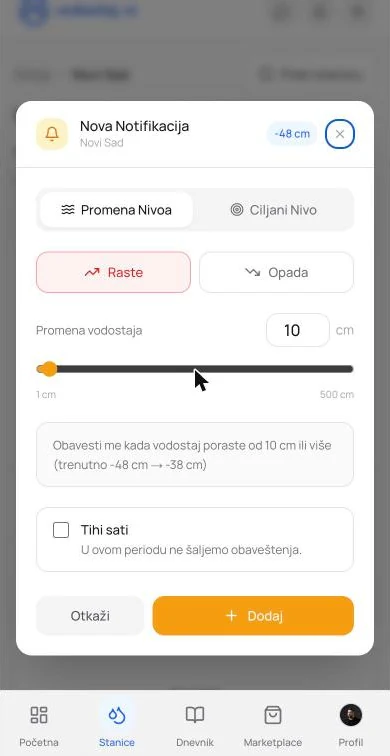
- User-defined thresholds: absolute level, or delta change over a window, with direction (rising above / falling below / both), designed as a two-step choice rather than a form, because most users do not know which type they need until they see the difference
- Regulation rules: closed seasons and minimum catch sizes per species and per water body, evaluated against the current date and location and surfaced on the station page as active constraints, with the legal source cited
- Every alert answers three questions on the notification itself: which station, which rule fired, and what reading triggered it, so the user can verify rather than trust
- Degraded states designed before the happy path: stale feed indicators, last-known-good values cached so a scraper failure never renders an empty screen, and an explicit "data may be stale" state instead of a silent wrong number
- The measure I care about: of 134 alerts users configured themselves, every one is still enabled months later. People switch off notifications that cry wolf. These they kept
Predictive layer
The first layer is live in beta: a 7-day water level forecast for about 140 stations, built on 35 years of historical readings and released on 5 November 2026. The next layer scores fishing conditions per station per day by combining water level and its trend, water and air temperature, pressure, recent upstream rainfall, moon phase, and the seasonal calendar. The first version is deliberately rule-based and weighted rather than learned: it is explainable, and every score can be broken down into the signals that produced it. A learned model only becomes honest once enough paired condition-and-outcome data exists to train on. The design constraint is the same either way: the output is a recommendation with visible reasoning and a visible confidence, not a number handed down.
- 35 years of historical readings as the baseline for trend and anomaly context
- Rule-based weighted scoring first: transparent and debuggable, no black box
- Plain-language explanation attached to every score, naming the signals that moved it
- 7-day outlook per station, with confidence degrading visibly as the horizon extends
Marketplace: Fishing Gear
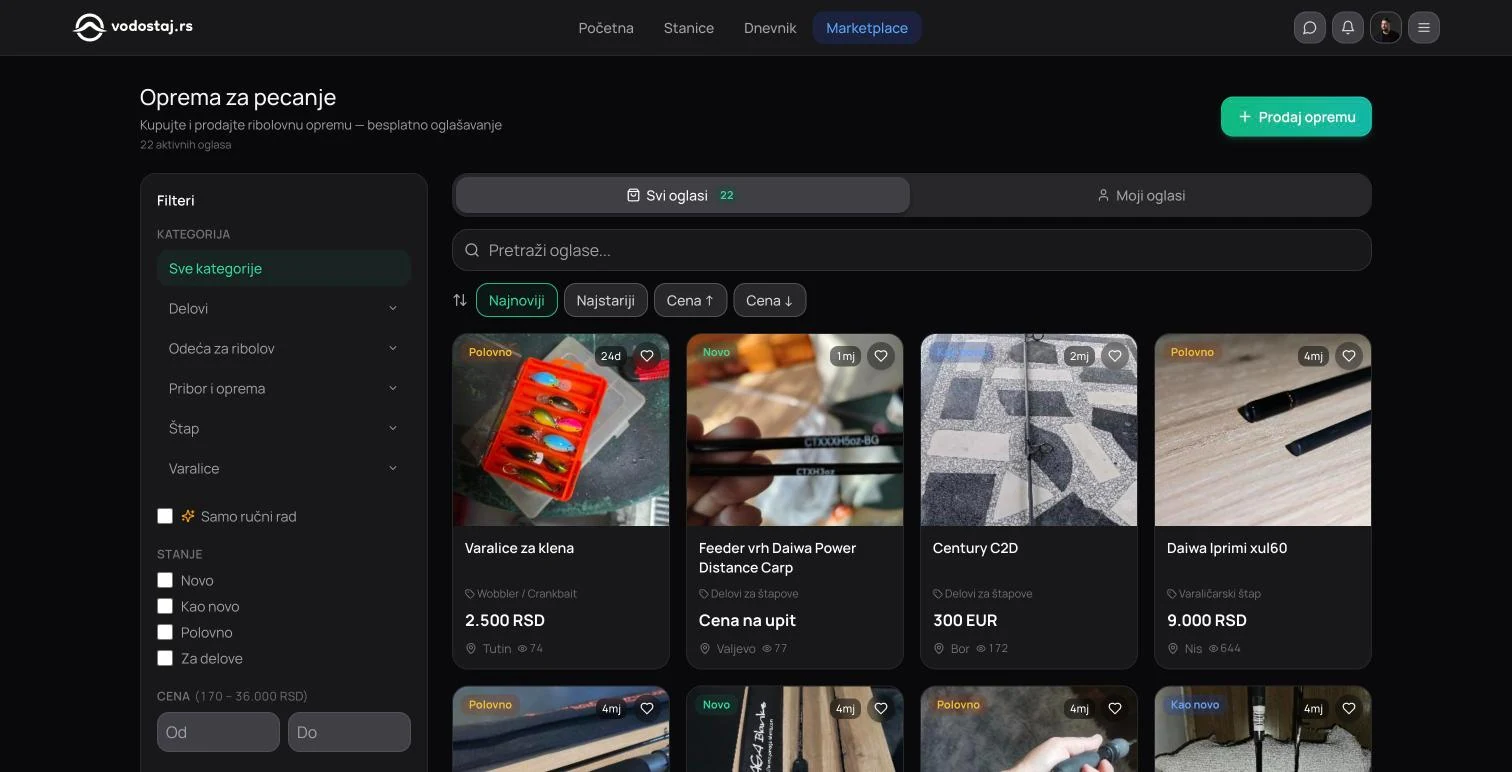
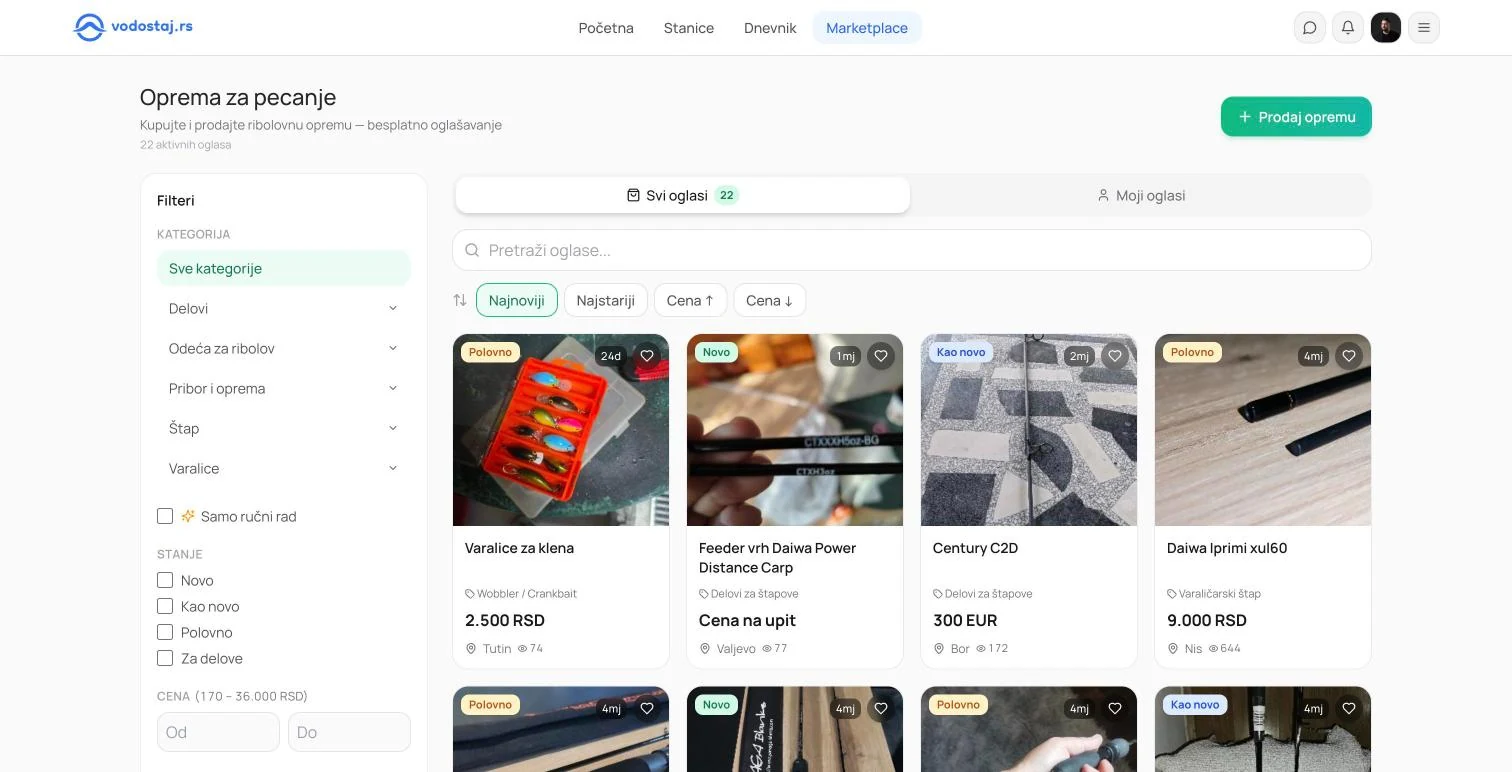
Community marketplace for buying and selling fishing gear: category, condition and price filters, search, and sorting. Card grid with condition badges (Novo, Kao novo, Polovno), listing age, location and views, and a "Prodaj opremu" CTA.
Mobile App
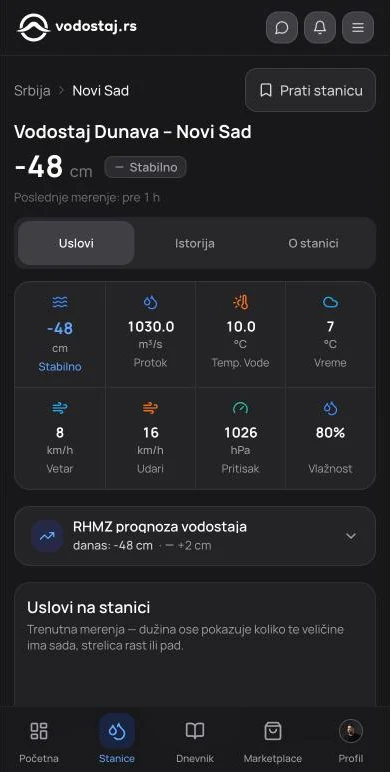
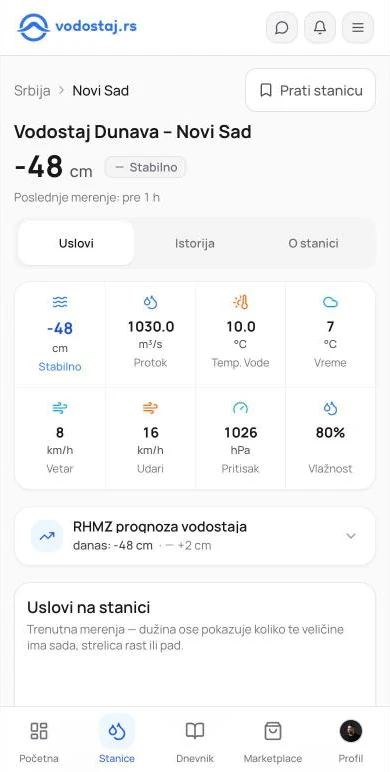
Full mobile-responsive experience with bottom tab navigation (Početna, Stanice, Dnevnik, Marketplace, Profil). Station detail is split into tabs (Uslovi, Istorija, O stanici), and threshold setup is a single focused sheet.
Approach
- Designed and built from zero: Vite + React + TypeScript + Supabase, later migrated to Next.js for SSR and indexable station pages
- Integrated 3,200+ monitoring stations across eight countries through a source-adapter layer, fed by automated scraping and direct API integrations with national meteorological agencies: adding a country means adding an adapter, not rewriting the core
- Custom scraping pipelines and Supabase Edge Functions for idempotent multi-source ingestion: re-running a time window never produces duplicate records
- Real-time charts with 7/30-day history, min/avg/max, and threshold markers per station
- Row-level security, authentication, and a push notification system with per-tier subscription limits
- Community marketplace for fishing gear, with moderation before listings go live
- AI-assisted development workflows throughout: design and implementation in the same loop
Outcomes
The leading service of its kind in Serbia. Measured in Search Console rather than estimated: 5.45M search impressions from launch to November 2026 and 139K organic clicks, at #1 regional rankings. 15,000 monthly active users, 89% of them on mobile.
